Plot cluster trajectories
Source:R/generics.R, R/trajectories.R, R/model.R
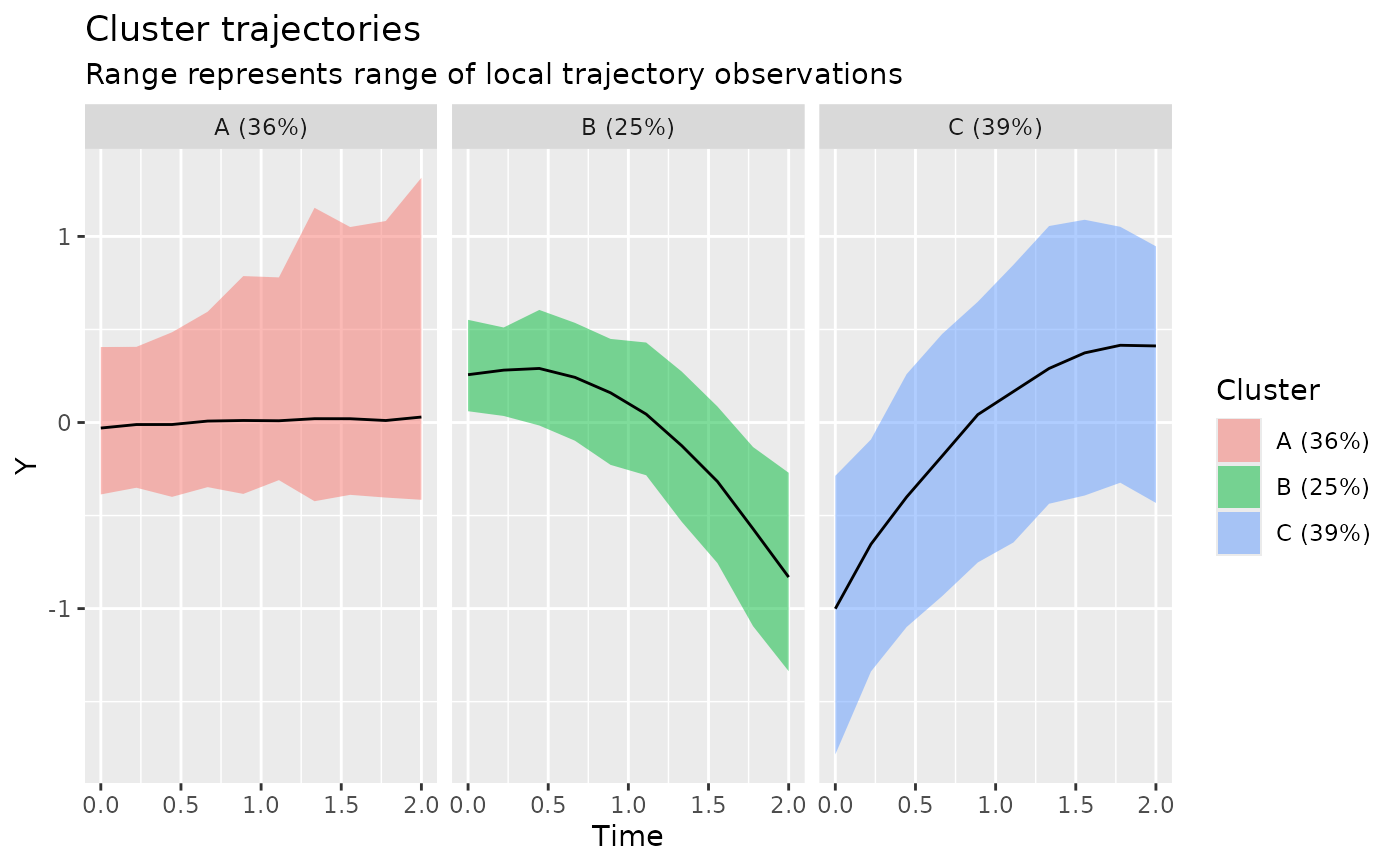
plotClusterTrajectories.RdPlot the cluster trajectories associated with the given model.
plotClusterTrajectories(object, ...)

# S4 method for class 'data.frame'
plotClusterTrajectories(
  object,
  response,
  cluster = "Cluster",
  clusterOrder = character(),
  clusterLabeler = make.clusterPropLabels,
  time = getOption("latrend.time"),
  center = meanNA,
  trajectories = c(FALSE, "sd", "se", "80pct", "90pct", "95pct", "range"),
  facet = !isFALSE(as.logical(trajectories[1])),
  id = getOption("latrend.id"),
  ...
)

# S4 method for class 'lcModel'
plotClusterTrajectories(
  object,
  what = "mu",
  at = time(object),
  clusterOrder = character(),
  clusterLabeler = make.clusterPropLabels,
  trajectories = FALSE,
  facet = !isFALSE(as.logical(trajectories[1])),
  ...
)
Arguments
- object
The (cluster) trajectory data.
- ...
Additional arguments passed to clusterTrajectories.
- response
The response variable name, see responseVariable.
- cluster
The cluster assignment column
- clusterOrder
Specify which clusters to plot and the order. Can be the cluster names or index. By default, all clusters are shown.
- clusterLabeler
A
function(clusterNames, clusterSizes)that generates plot labels for the clusters. By default the cluster name with the proportional size is shown, see make.clusterPropLabels.- time
The time variable name, see timeVariable.
- center
A function for aggregating multiple points at the same point in time
- trajectories
Whether to additionally plot the original trajectories (
TRUE), or to show the expected interval (standard deviation, standard error, range, or percentile range) of the observations at the respective moment in time.Note that visualizing the expected intervals is currently only supported for time-aligned trajectories, as the interval is computed at each unique moment in time. By default (
FALSE), no information on the underlying trajectories is shown.- facet
Whether to facet by cluster. This is done by default when
trajectoriesis enabled.- id
Id column. Only needed when
trajectories = TRUE.- what
The distributional parameter to predict. By default, the mean response 'mu' is predicted. The cluster membership predictions can be obtained by specifying
what = 'mb'.- at
A
numeric vectorof the times at which to compute the cluster trajectories.
Value
A ggplot object.
See also
Other lcModel functions:
clusterNames(),
clusterProportions(),
clusterSizes(),
clusterTrajectories(),
coef.lcModel(),
converged(),
deviance.lcModel(),
df.residual.lcModel(),
estimationTime(),
externalMetric(),
fitted.lcModel(),
fittedTrajectories(),
getCall.lcModel(),
getLcMethod(),
ids(),
lcModel-class,
metric(),
model.frame.lcModel(),
nClusters(),
nIds(),
nobs.lcModel(),
plot-lcModel-method,
plotFittedTrajectories(),
postprob(),
predict.lcModel(),
predictAssignments(),
predictForCluster(),
predictPostprob(),
qqPlot(),
residuals.lcModel(),
sigma.lcModel(),
strip(),
time.lcModel(),
trajectoryAssignments()
Examples
data(latrendData)
method <- lcMethodLMKM(Y ~ Time, id = "Id", time = "Time")
model <- latrend(method, latrendData, nClusters = 3)

if (require("ggplot2")) {
  plotClusterTrajectories(model)

  # show cluster sizes in labels
  plotClusterTrajectories(model, clusterLabeler = make.clusterSizeLabels)

  # change cluster order
  plotClusterTrajectories(model, clusterOrder = c('B', 'C', 'A'))

  # sort clusters by decreasing size
  plotClusterTrajectories(model, clusterOrder = order(-clusterSizes(model)))

  # show only specific clusters
  plotClusterTrajectories(model, clusterOrder = c('B', 'C'))

  # show assigned trajectories
  plotClusterTrajectories(model, trajectories = TRUE)

  # show 95th percentile observation interval
  plotClusterTrajectories(model, trajectories = "95pct")

  # show observation standard deviation
  plotClusterTrajectories(model, trajectories = "sd")

  # show observation standard error
  plotClusterTrajectories(model, trajectories = "se")

  # show observation range
  plotClusterTrajectories(model, trajectories = "range")
}