Plots the output of trajectories for the given object.
plotTrajectories(object, ...)

# S4 method for class 'data.frame'
plotTrajectories(
  object,
  response,
  cluster,
  time = getOption("latrend.time"),
  id = getOption("latrend.id"),
  facet = TRUE,
  ...
)

# S4 method for class 'ANY'
plotTrajectories(object, ...)

# S4 method for class 'lcModel'
plotTrajectories(object, ...)
Arguments
- object
The data or model or extract the trajectories from.
- ...
Additional arguments passed to trajectories.
- response
Response variable
charactername or acall.- cluster
Whether to plot trajectories grouped by cluster (determined by the "Cluster" column). Alternatively, the name of the cluster column indicating trajectory cluster membership. If unspecified, trajectories are grouped if the object contains a "Cluster" column.
- time
The time variable name, see timeVariable.
- id
The identifier variable name, see idVariable.
- facet
Whether to facet by cluster.
Examples
data(latrendData)
if (require("ggplot2")) {
plotTrajectories(latrendData, response = "Y", id = "Id", time = "Time")
plotTrajectories(
latrendData,
response = quote(exp(Y)),
id = "Id",
time = "Time"
)
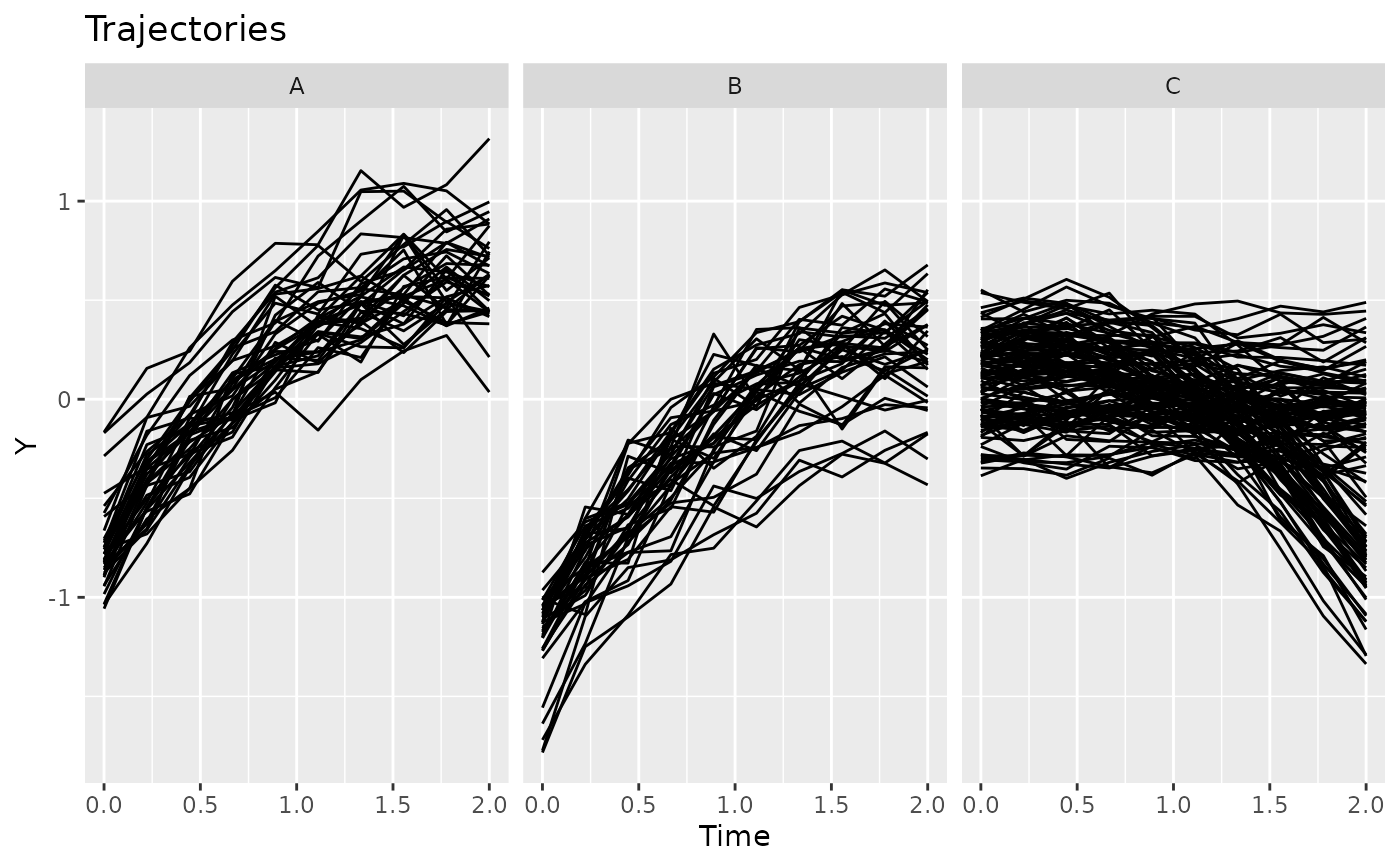
plotTrajectories(
latrendData,
response = "Y",
id = "Id",
time = "Time",
cluster = "Class"
)
}
 data(latrendData)
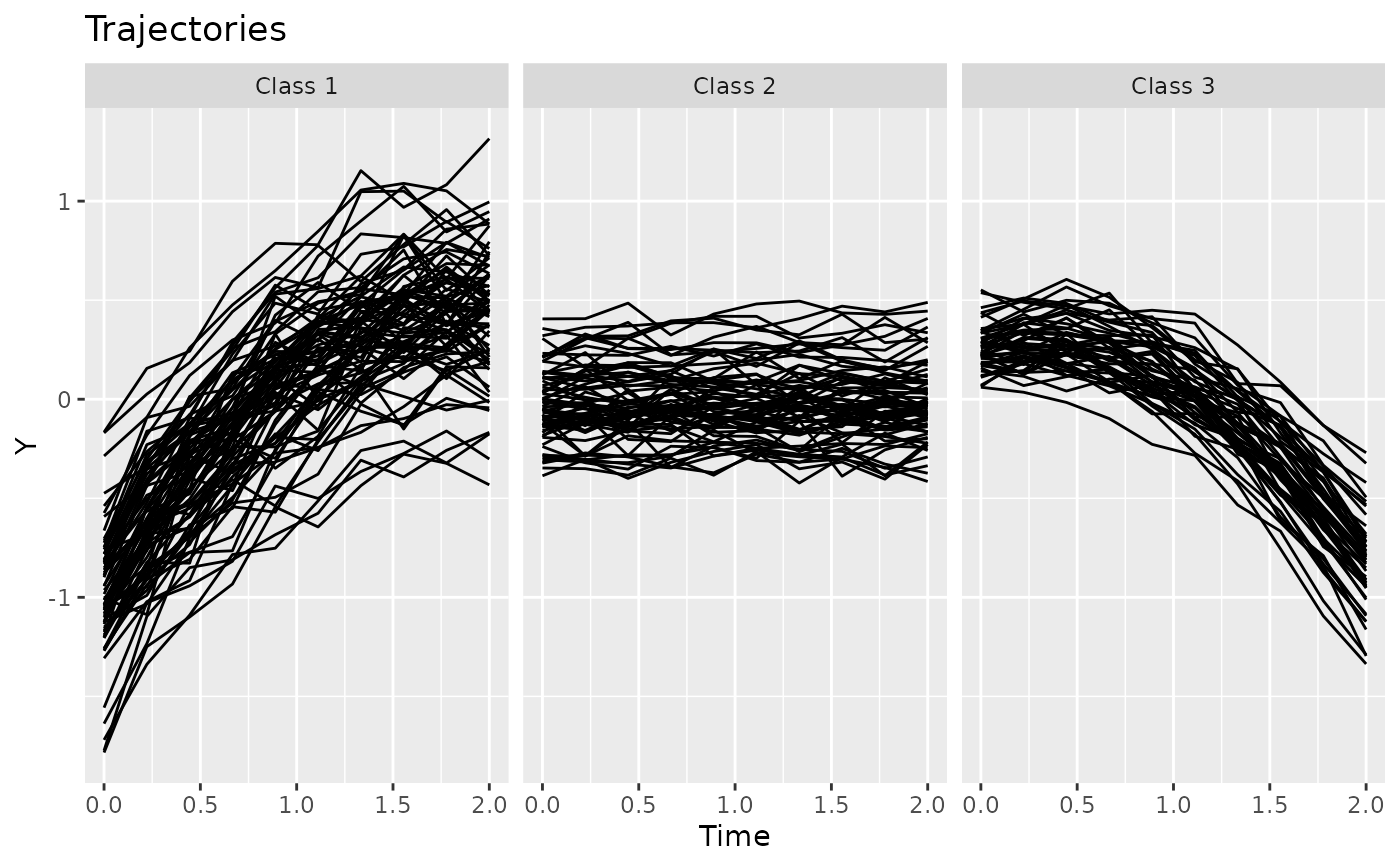
method <- lcMethodLMKM(Y ~ Time, id = "Id", time = "Time")
model <- latrend(method, latrendData, nClusters = 3)
if (require("ggplot2")) {
plotTrajectories(model)
}
data(latrendData)
method <- lcMethodLMKM(Y ~ Time, id = "Id", time = "Time")
model <- latrend(method, latrendData, nClusters = 3)
if (require("ggplot2")) {
plotTrajectories(model)
}