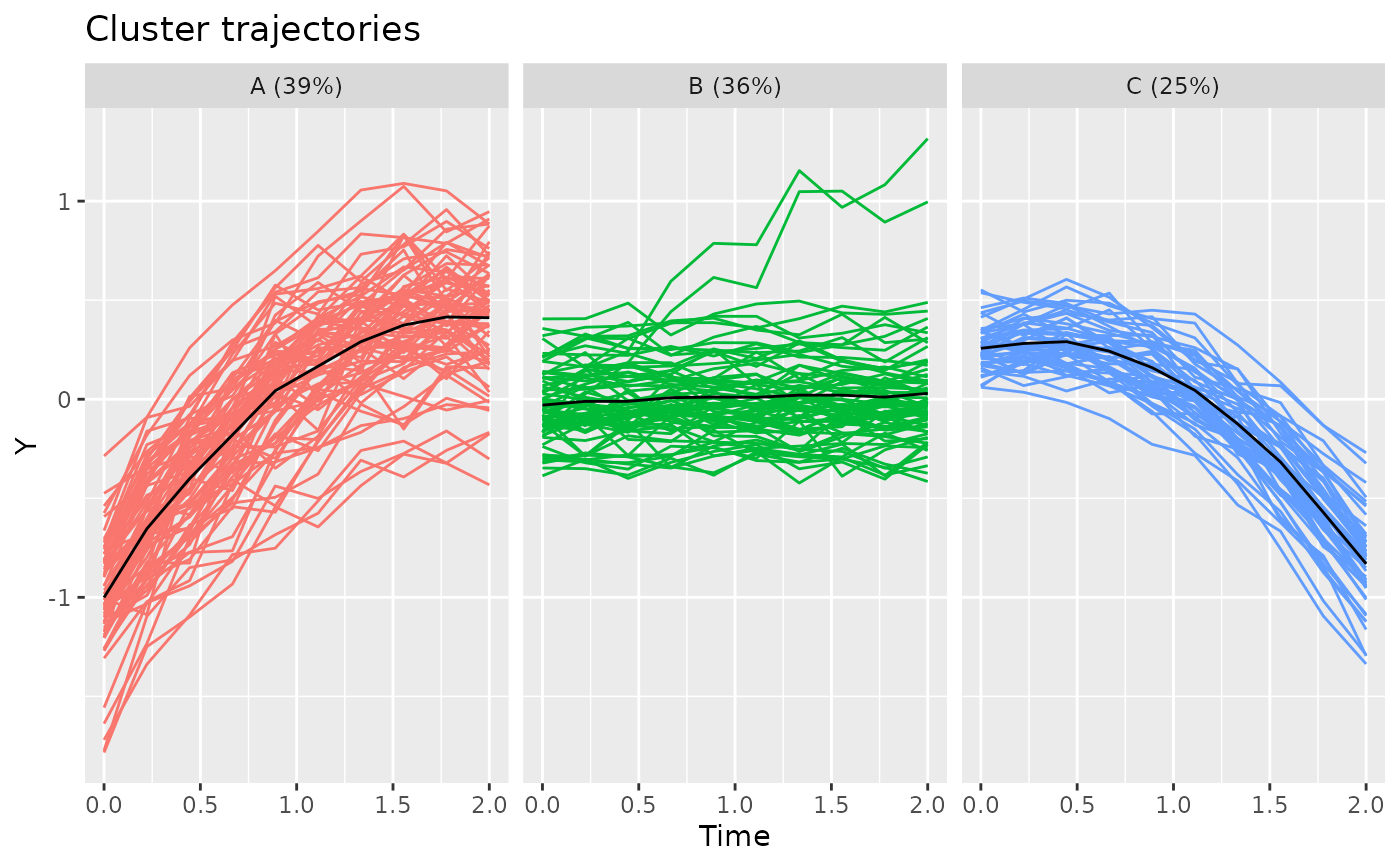
Plot a lcModel object.
By default, this plots the cluster trajectories of the model, along with the trajectories used for estimation.
# S4 method for class 'lcModel'
plot(x, y, ...)
Arguments
- x
The
lcModelobject.- y
Not used.
- ...
Arguments passed on to
plotClusterTrajectoriesobjectThe (cluster) trajectory data.
Value
A ggplot object.
See also
plotClusterTrajectories plotFittedTrajectories plotTrajectories ggplot2::ggplot
Other lcModel functions:
clusterNames(),
clusterProportions(),
clusterSizes(),
clusterTrajectories(),
coef.lcModel(),
converged(),
deviance.lcModel(),
df.residual.lcModel(),
estimationTime(),
externalMetric(),
fitted.lcModel(),
fittedTrajectories(),
getCall.lcModel(),
getLcMethod(),
ids(),
lcModel-class,
metric(),
model.frame.lcModel(),
nClusters(),
nIds(),
nobs.lcModel(),
plotClusterTrajectories(),
plotFittedTrajectories(),
postprob(),
predict.lcModel(),
predictAssignments(),
predictForCluster(),
predictPostprob(),
qqPlot(),
residuals.lcModel(),
sigma.lcModel(),
strip(),
time.lcModel(),
trajectoryAssignments()