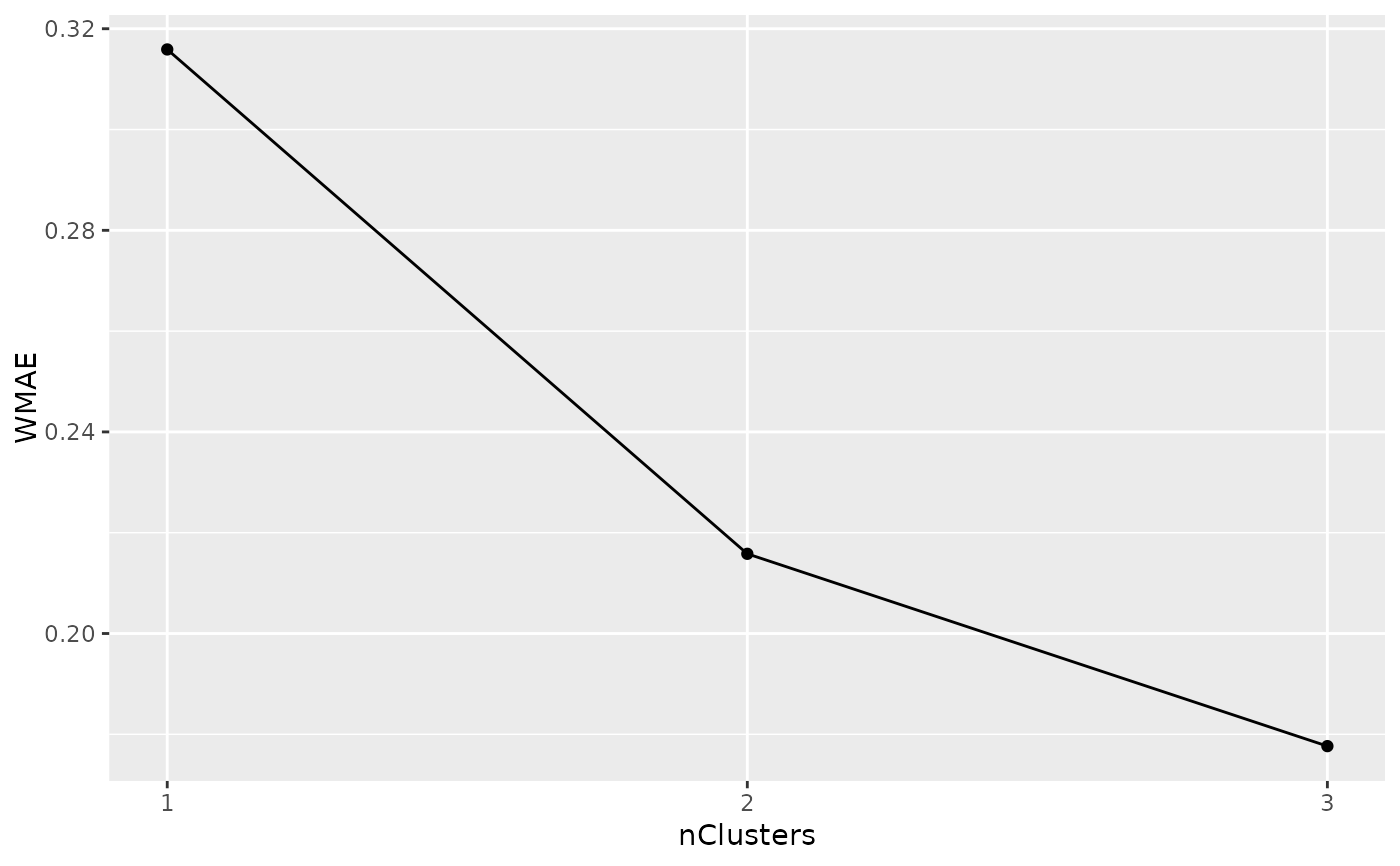
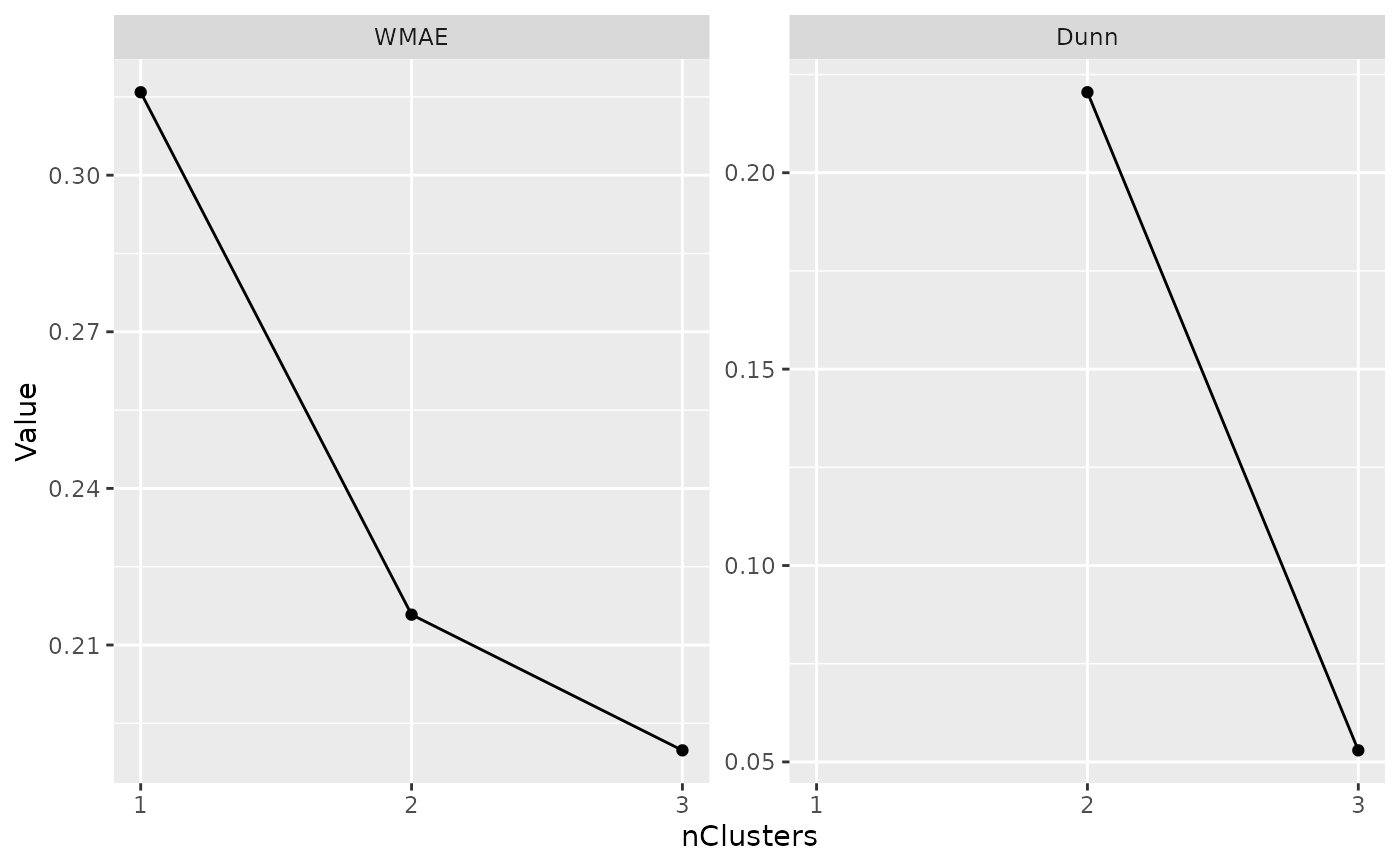
Plot one or more internal metrics for all lcModels
plotMetric(models, name, by = "nClusters", subset, group = character())Arguments
- models
A
lcModelsor list oflcModelobjects to compute and plot the metrics of.- name
The name(s) of the metric(s) to compute. If no names are given, the names specified in the
latrend.metricoption (WRSS, APPA, AIC, BIC) are used.- by
The argument name along which methods are plotted.
- subset
Logical expression based on the
lcModelmethod arguments, indicating whichlcModelobjects to keep.- group
The argument names to use for determining groups of different models. By default, all arguments are included. Specifying
group = character()disables grouping. Specifying a single argument for grouping uses that specific column as the grouping column. In all other cases, groupings are represented by a number.
Value
ggplot2 object.
Functionality
Print an argument summary for each of the models.
Convert to a
data.frameof method arguments.Subset the list.
Compute an internal metric or external metric.
Obtain the best model according to minimizing or maximizing a metric.
Obtain the summed estimation time.
Plot a metric across a variable.
See also
Other lcModels functions:
as.lcModels(),
lcModels,
lcModels-class,
max.lcModels(),
min.lcModels(),
print.lcModels(),
subset.lcModels()
Examples
data(latrendData)
method <- lcMethodLMKM(Y ~ Time, id = "Id", time = "Time")
methods <- lcMethods(method, nClusters = 1:3)
models <- latrendBatch(methods, latrendData)

if (require("ggplot2")) {
  plotMetric(models, "WMAE")
}


if (require("ggplot2") && require("clusterCrit")) {
  plotMetric(models, c("WMAE", "Dunn"))
}
#> Warning: Removed 1 row containing missing values or values outside the scale range
#> (`geom_point()`).
