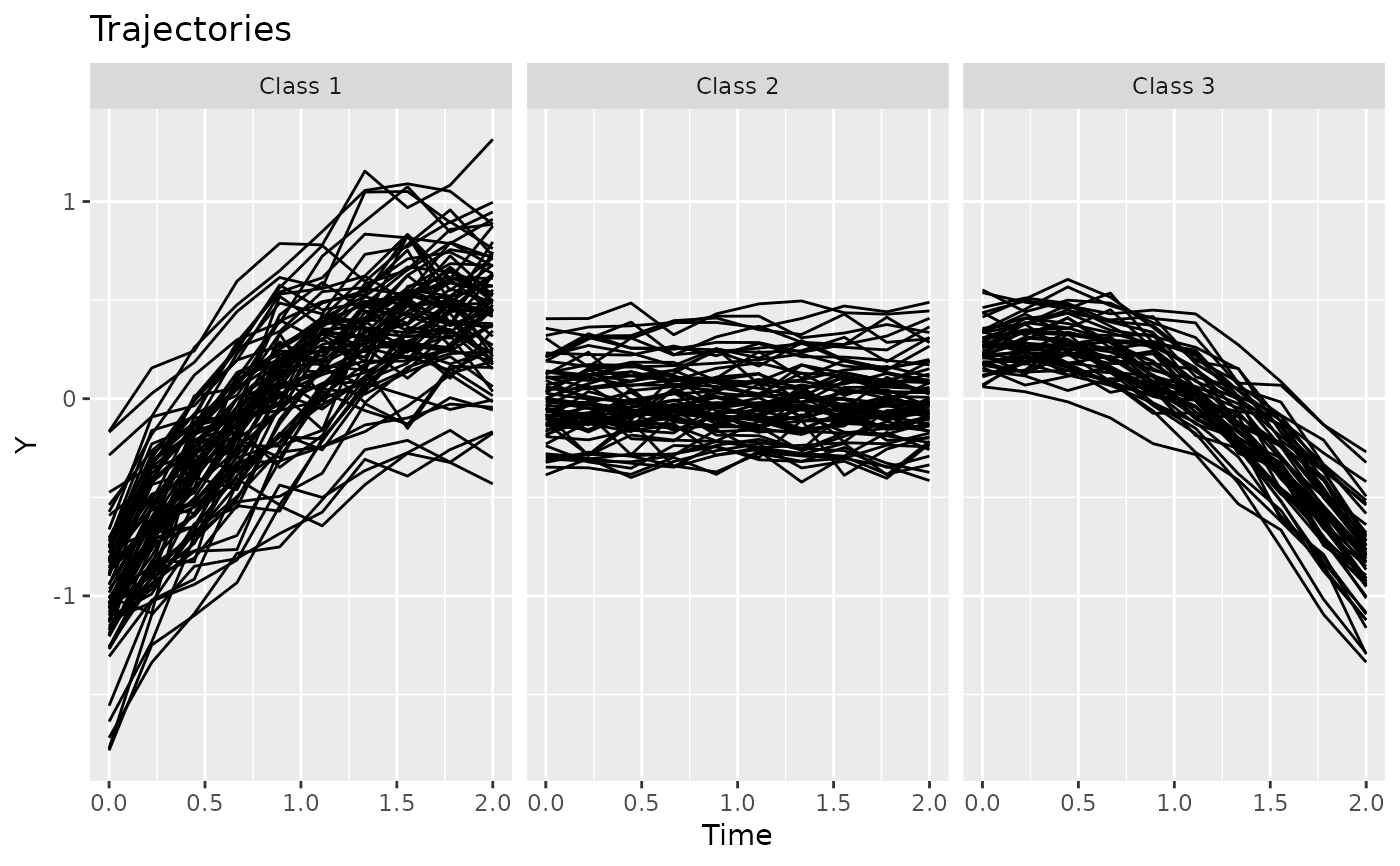
An artificial longitudinal dataset comprising 200 trajectories belonging to one of 3 classes. Each trajectory deviates in intercept and slope from its respective class trajectory.
latrendDataFormat
A data.frame comprising longitudinal observations from 200 trajectories.
Each row represents the observed value of a trajectory at a specific moment in time.
- Id
integer: The trajectory identifier.- Time
numeric: The measurement time, between 0 and 2.- Y
numeric: The observed value at the respective timeTimefor trajectoryId.- Class
factor: The reference class.
Source
This dataset was generated using generateLongData.
See also
Examples
data(latrendData)

if (require("ggplot2")) {
  plotTrajectories(latrendData, id = "Id", time = "Time", response = "Y")

  # plot according to the reference class
  plotTrajectories(latrendData, id = "Id", time = "Time", response = "Y", cluster = "Class")
}
