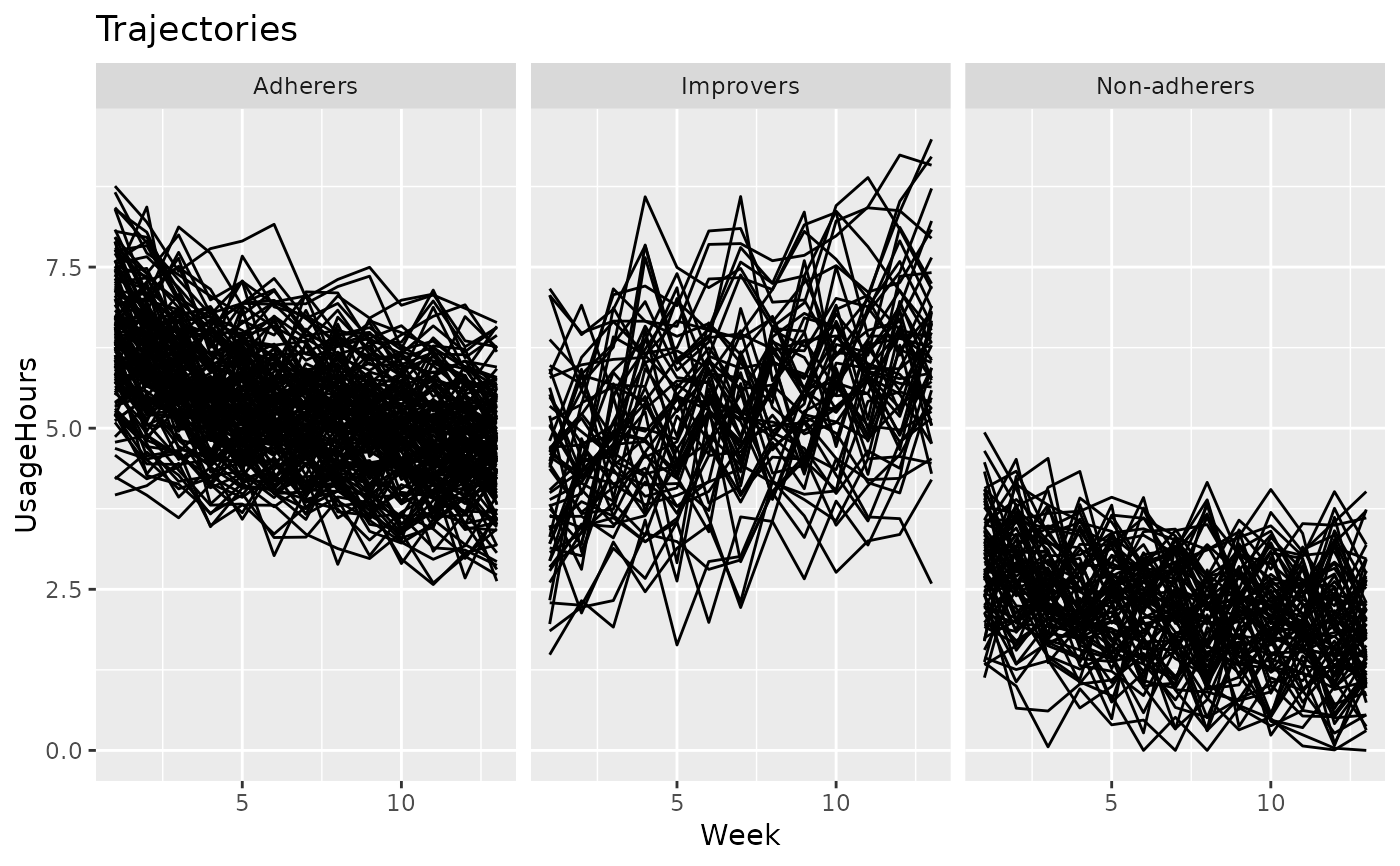
A simulated longitudinal dataset comprising 301 patients with obstructive sleep apnea (OSA) during their first 91 days (13 weeks) of PAP therapy. The longitudinal patterns were inspired by the adherence patterns reported by Yi et al. (2022), interpolated to weekly hours of usage.
PAP.adhFormat
A data.frame comprising longitudinal data of 500 patients, each having 26 observations
over a period of 1 year.
Each row represents a patient observation interval (two weeks), with columns:
- Patient
integer: The patient identifier, where each level represents a simulated patient.- Week
integer: The week number, starting from 1.- UsageHours
numeric: The mean hours of usage in the respective week. Greater than or equal to zero, and typically around 4-6 hours.- Group
factor: The reference group (i.e., adherence pattern) from which this patient was generated.
yi2022identifyinglatrend
See also
Examples
data(PAP.adh)

if (require("ggplot2")) {
  plotTrajectories(PAP.adh, id = "Patient", time = "Week", response = "UsageHours")

  # plot according to cluster ground truth
  plotTrajectories(
    PAP.adh,
    id = "Patient",
    time = "Week",
    response = "UsageHours",
    cluster = "Group"
  )
}
#> Loading required package: ggplot2